Excel and SharePoint
The spreadsheets and shared folders most companies already run on.


Beta waitlist open
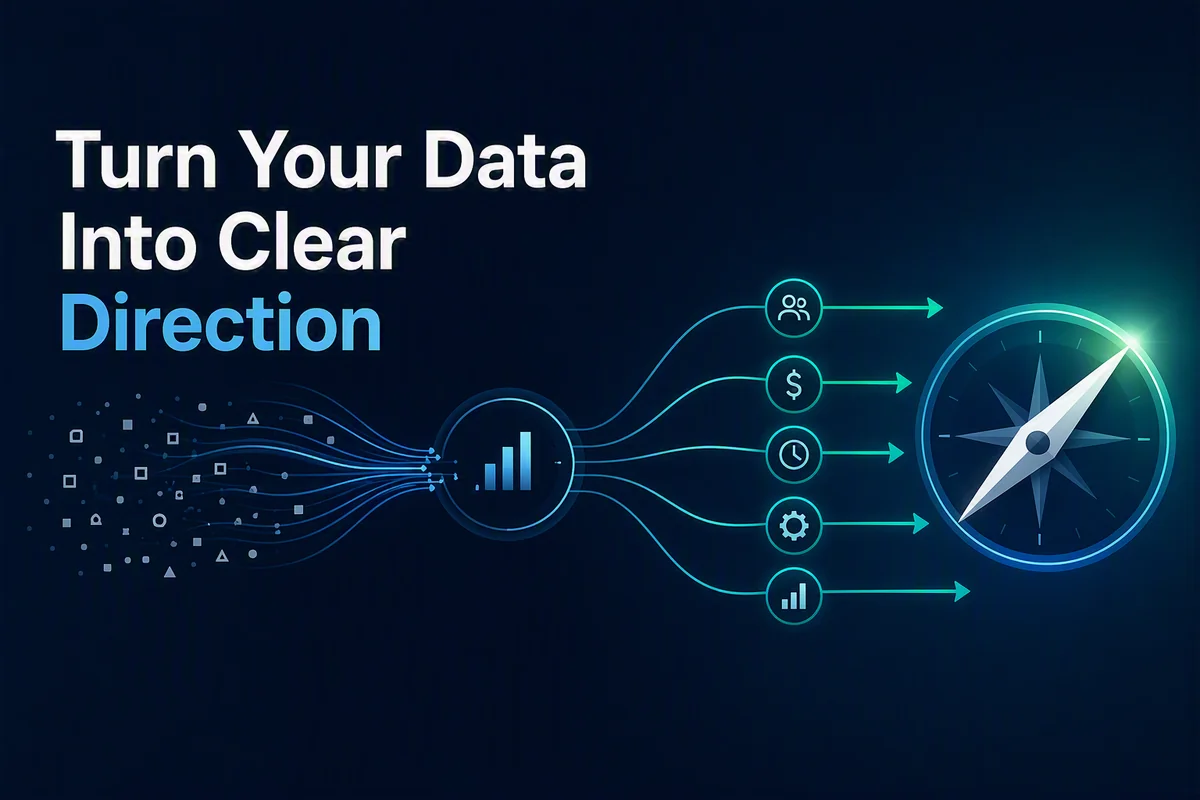
VectorAtlas gives business owners and operators a clear view of business performance without requiring an in-house analyst or another dashboard to manage. The platform analyzes financial and operational data, surfaces important trends, risks, and opportunities, and delivers the findings as plain-English business intelligence supported by KPI and forecast charts.

Built for owners and operators of growing companies, most often $5M–$150M in revenue (there is no hard cutoff either way) who do not have an in-house analytics team. We are inviting a limited number of businesses to join our early access program before public launch.
Most operational BI tools hand you another dashboard and expect you to go looking for the problem. Owners and operators of mid-size companies do not have time for that, and most do not have an analyst whose job is to look. VectorAtlas flips it: it watches your numbers on a schedule and tells you, unprompted, what changed, what is about to go wrong, and what is worth chasing.
Each briefing pairs that narrative with simplified trend, KPI and forecast charts, delivered as a short read rather than a login you have to go explore.
“Your Operational Score is 74, up 3 points from last week. Margin held steady even though revenue dipped 4%: overtime hours dropped enough in your scheduling data to offset it. Watch AR: two accounts crossed 60 days past due this week, together worth $18,400. Recommended this week: follow up on the Henderson and Alvarez invoices before they age further.”
Illustrative sample briefing excerpt, not a real customer’s data.
VectorAtlas is business intelligence for small and mid-sized businesses that want business performance analysis without building a reporting team. It combines financial analytics and operational analytics in one view, so you can see how revenue, margin, receivables, scheduling and workforce numbers connect, rather than reading each report on its own.
Each briefing is a form of automated business reporting: KPI reporting and business performance reporting that arrive on a schedule, written as business insights you can act on. The financial and operational reporting is produced for you from the data you already have.
Alongside the written briefing, VectorAtlas includes simple trend and forecast charts, so business forecasting is part of the same short read: where a KPI is heading, not just where it was last week. The forecasts are drawn from your own connected data and shown next to the numbers they come from.
Every number in a VectorAtlas briefing is computed from your own connected data using inspectable formulas, not generated from a prompt. Before you ever see a sentence, it is checked against the numbers it describes; anything that cannot be verified is flagged, never hidden. The AI’s only job is writing the plain-English sentence around numbers a deterministic engine already computed and checked.
That is the difference between VectorAtlas and a chatbot layered on top of your accounting system: we show our work.
The spreadsheets and shared folders most companies already run on.
Connect an existing operations or accounting database directly.
Upload PDFs that contain tables, such as exported reports and statements, and VectorAtlas reads them as data. Upload a new PDF to bring in fresh numbers.
Connector support is going through Intuit’s app review process.
Delivery is by email or PDF: weekly by default, with daily available on higher-tier plans. No login required to get value.
Business intelligence for a mid-sized business has usually meant either an expensive analytics platform or a spreadsheet someone maintains by hand. VectorAtlas is the middle path, built for the CEO, managing partner or COO of a company too small to have a dedicated analytics team but large enough that gut feel is starting to miss things. If that sounds like you, join the waitlist even if your revenue falls outside the $5M–$150M band.
If your firm already offers CAS, bookkeeping or advisory services, VectorAtlas is built to be delivered through you, not around you: white-labeled or co-branded briefings for the clients you already serve, reviewed by your firm before they go out. VectorAtlas looks at a business’s own operations firm-wide. It is not a replacement for FirmMetrics™, which is an accounting firm’s own internal realization, WIP and utilization dashboard. Tell us in your waitlist email that you are an accounting, bookkeeping or advisory firm serving clients, and we will reach out about the white-label option.
We are recruiting beta customers ahead of launch. Join the waitlist and we will reach out as spots open, with no commitment and no price to see yet.
Email us your name, company, approximate annual revenue, where your data lives (QuickBooks Online, Excel/SharePoint, a SQL database, PDF reports or other), and whether you are an accounting, bookkeeping or advisory firm serving clients.
VectorAtlas is a plain-English operational business intelligence briefing for growing companies. It watches your numbers on a schedule and tells you what changed, what is about to go wrong and what is worth acting on, with simple trend, KPI and forecast charts. It is in beta, and you can join the waitlist.
Operational business intelligence is the day-to-day view of how a business is running: finance, operations, customers and workforce. VectorAtlas turns that data into a short written briefing instead of a dashboard you have to go and explore.
No. It is built for companies without an in-house analytics team. The briefing arrives by email or PDF, and no login is required to get value.
Weekly by default, and daily on higher-tier plans. Delivery is by email or PDF.
Excel and SharePoint, SQL databases and PDF reports that contain tables. QuickBooks Online connectivity is going through Intuit’s app review process.
Mostly growing companies of roughly $5M–$150M in revenue, with no hard cutoff either way, run by owners and operators such as a CEO, managing partner or COO.
It is the practice of turning your own financial and operational data into insight you can act on. For a small or mid-sized business, VectorAtlas does this without an analytics team or a dashboard to learn: it analyzes your data and delivers a plain-English business intelligence briefing with KPI and forecast charts.
Yes. It looks at finance, operations, customers and workforce together, so financial analytics such as revenue, margin and receivables sit alongside operational analytics such as scheduling and overtime in the same briefing.
Yes. Briefings are produced on a schedule, weekly by default and daily on higher-tier plans, and arrive by email or PDF with KPI, trend and forecast charts. Every number is computed from your connected data and checked before you read it.
VectorAtlas includes simple forecast charts alongside trend and KPI charts, drawn from your own data, so you can see where a number is heading as well as where it has been.
No. Every number is computed from your data with inspectable formulas, and every sentence is checked against those numbers before you see it. Anything unverifiable is flagged, never hidden. The AI writes the plain-English sentence; it does not generate the numbers.
FirmMetrics is an accounting firm’s own internal KPI dashboard (realization, WIP, AR) built for managing partners. VectorAtlas is a weekly (or daily, on higher-tier plans) operational briefing for any growing business, roughly $5M–$150M in revenue, covering finance, operations, customers and workforce, delivered by email instead of a dashboard you log into.
VectorAtlas is currently in beta with a waitlist, and pricing is not published yet. Join the waitlist and we will reach out with beta details as spots open.
QuickBooks Online connectivity is going through Intuit’s app review process. Excel/SharePoint, direct SQL database connections and PDF reports are supported today.
Yes. Mention it in your waitlist email and we will reach out about white-labeled or co-branded briefings your firm can offer as part of a CAS, bookkeeping or advisory engagement.
See all of our products, or get in touch.